




The most important points at a glance:
- The balance sheet and income statement together form the basis of a company’s annual financial statements.
- The balance sheet shows assets, liabilities and equity at a specific point in time, while the income statement reflects the economic performance for a given period.
- The two statements are closely linked: The annual profit or loss from the income statement changes equity in the balance sheet.
- The structure of the income statement shows where a company earns money and what costs are incurred.
- Key figures derived from the balance sheet and income statement help to assess a company’s earning power and stability.
- The correct interpretation of these figures enables a well-founded assessment of a company’s financial situation.
What are the balance sheet and income statement?
The balance sheet and income statement are the central components of a company’s annual financial statements and are among the most important tools of financial reporting. The balance sheet shows the asset and capital structure at a specific point in time, while the income statement reflects the economic performance for a period.
In Swiss accounting, the annual financial statements form the basis for transparency regarding a company’s financial situation. They generally consist of three elements:
- Balance sheet
- Income statement
- Notes
In addition to the balance sheet and income statement, the notes are also part of the annual financial statements. They contain additional explanations on individual items and supplement the two core statements with further information.
A fundamental principle of the balance sheet is the so-called balance sheet equation. It describes the relationship between assets and financing and ensures that every balance sheet is balanced.
| Side of the balance sheet | Content |
| Assets | Company assets (e.g. cash and cash equivalents, receivables, fixed assets) |
| Liabilities | Financing of these assets through debt and equity |
This structure can be summarised in a simple formula:
Assets = Liabilities + Equity
The balance sheet therefore always shows a balance between a company’s assets and how they are financed.
What does the balance sheet show?
The balance sheet presents a company’s financial situation at a specific point in time – usually at the end of a financial year. It shows which assets are available and how they have been financed.
Typical items on the asset side include, for example:
- cash and cash equivalents
- receivables from customers
- inventories
- machinery or real estate
The liability side shows the sources of capital:
- Debt capital, such as loans or payables
- Equity of the owners or shareholders
The balance sheet thus primarily provides information about the structure and stability of a company’s finances.
What does the income statement show?
The income statement – often also called the profit and loss statement (P&L) – shows the economic development of a company over a specific period.
It contrasts two key figures:
- Income, for example revenue from goods delivered and services rendered
- Expenses, such as material, personnel or operating costs
This comparison yields the result for the period:
- Annual profit if income is higher than expenses
- Annual loss if expenses exceed income
The income statement therefore shows how profitable a company operates during a financial year and forms the basis for further analyses of the company’s development.
How are the balance sheet, income statement and equity related?
The annual profit or loss from the income statement changes equity in the balance sheet. The two statements are therefore directly linked and together form a closed financial reporting system.
In practice, this means: The income statement shows how a company is performing economically, while the balance sheet shows how this development affects assets and capital structure.
If a company generates a profit, equity increases. If a loss is incurred, equity decreases accordingly. This makes it visible how operating results directly impact a company’s equity and capital structure.
The relationship between the two statements can be illustrated in simplified form as follows:
| Transaction during the financial year | Impact on equity |
| Annual profit | Equity increases |
| Annual loss | Equity decreases |
| Dividend distribution | Equity decreases |
This connection is a central element of financial reporting, as it ensures that a company’s economic development can be tracked over several years.
For practice this means: The balance sheet and income statement should never be viewed in isolation. Only their combined analysis shows how operating results affect a company’s financial stability in the long term.
“The link between the income statement and equity makes visible how operating results affect a company’s financial structure over the long term.” – Curd Fasching, fiduciary
Why is this connection important for companies?
The link between the income statement and the balance sheet ensures that a company’s economic development is presented transparently.
Typical relationships include, for example:
- Profits increase equity and strengthen a company’s financial base.
- Losses reduce equity and can affect stability in the long term.
- Dividend distributions also change equity, even though they do not arise from operating activities.
For companies, this means that operating results always have long-term effects on the capital structure.
Anyone who considers the balance sheet and income statement together can therefore better understand
- how sustainably a company operates,
- how stable the capital structure is, and
- how the financial development changes over several years.
What is the typical structure of an income statement?
The income statement contrasts income and expenses for a period and shows whether a company generates a profit or a loss. Its structure also makes visible which income sources and cost blocks significantly influence the annual result.
In practice, the income statement is usually structured so that it leads from operating activities to the result for the period. It typically starts with sales revenue and then shows the most important expense blocks.
This is followed by items that can further influence the result, such as depreciation or financial effects. At the end stands the annual result, which subsequently flows into the balance sheet via equity.
To help you “read” an income statement quickly, this mental sequence is useful:
- Income (where does the money come from?)
- Expenses (where are the costs incurred?)
- Further result elements (what distorts/shifts the result?)
- Annual result (profit or loss)
Which income is reported in the income statement?
Income reflects a company’s economic output. In most SMEs, net revenue from goods delivered and services rendered is the key item. Depending on the business model, additional operating income may be added, for example from ancillary revenue.
In addition, changes in inventory can be relevant (especially where goods are stored or in production). This item is important because it can influence the result, even if no cash flow occurs at the same time.
Typical income items are:
- Sales revenue/net revenue from goods delivered and services rendered
- other operating income
- changes in inventory (if relevant)
Which expenses affect the result?
Expenses show which resources a company has used to render its services. For many companies, personnel expenses and other operating expenses are the largest blocks; in trade and production, material or goods expense is also key.
What matters less here is every individual detail item and more the understanding of which cost blocks drive profitability and how they develop in relation to revenue.
Typical expense blocks are:
- material or goods expense
- personnel expenses
- other operating expenses (e.g. rent, IT, marketing, administration)
Which other items influence the result?
In addition to operating income and expenses, other items affect the annual result. Depreciation reflects the loss of value of assets over time and can significantly shape the result, even though no payment is made at that moment. The financial result (e.g. interest expense) shows effects arising from financing and investment of funds.
In some years, there are also extraordinary or one-off effects. You should consciously treat these as special cases when interpreting the figures so that the operating development is not “masked”.
What is a single-step or multi-step income statement?
In a single-step income statement, all income and expenses are combined in one presentation so that the annual result is visible directly. A multi-step income statement additionally reports intermediate results. In practice this is often more helpful, because you can better separate operating and non-operating effects.
Typical intermediate results include operating profit or earnings before taxes (EBT). These steps help CFOs and financial managers in particular to identify the causes of changes in results more quickly.
What is the difference between the total cost method and the cost of sales method?
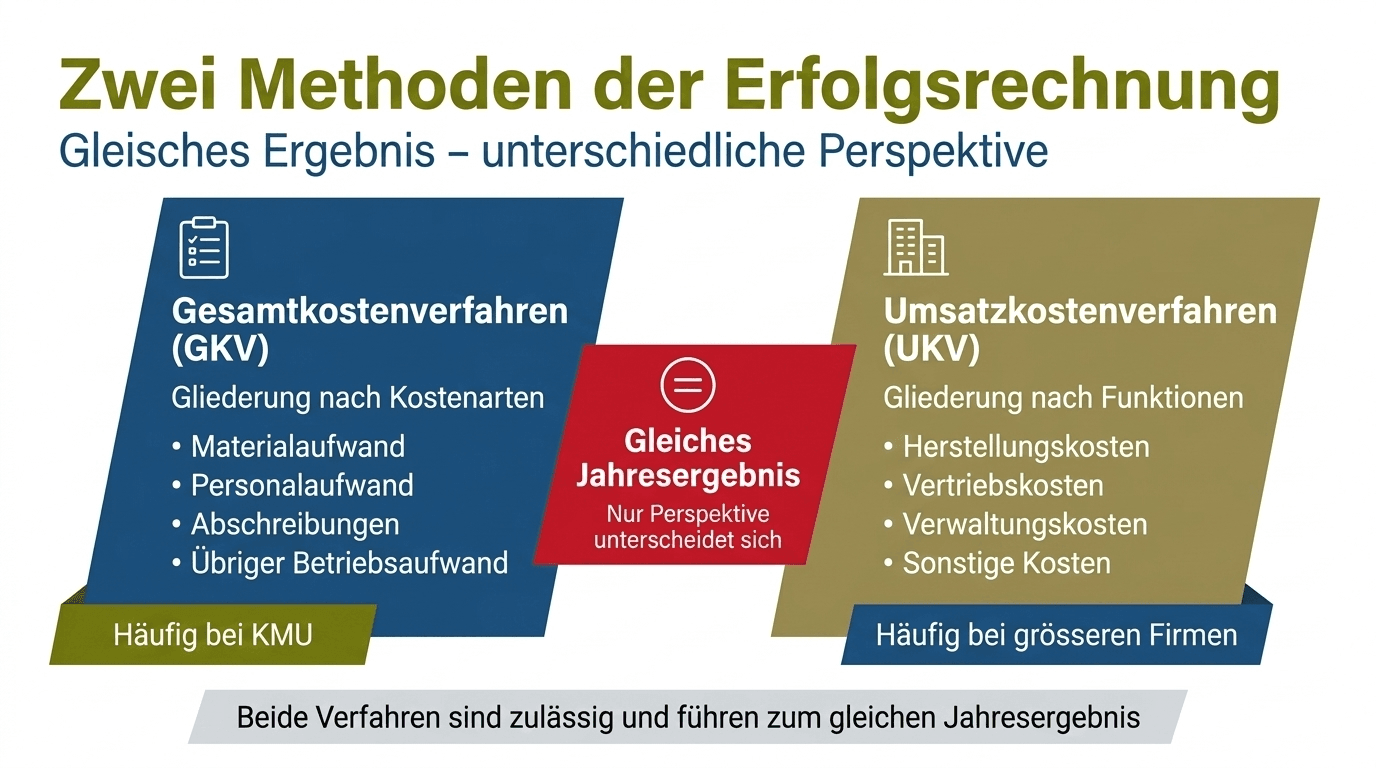
The total cost method (GKV) and the cost of sales method (UKV) are two different ways of presenting the income statement. Both lead to the same annual result, but differ in how expenses are structured and disclosed.
The difference does not lie in the result itself but in the perspective on costs. While the total cost method structures costs by type of cost, the cost of sales method allocates them by functions within the company.
| Characteristic | Total cost method (GKV) | Cost of sales method (UKV) |
| Basic principle | Costs are presented by type of cost | Costs are presented by company function |
| Perspective | Which types of costs arise in the company? | In which areas do costs arise? |
| Typical structure | Material, personnel, depreciation, other expenses | Production, sales, administration |
| Use | Often in SMEs | Often in larger or internationally active companies |
| Data basis | Can be derived directly from financial accounting | Usually requires additional cost accounting |
In Switzerland, many small and medium-sized enterprises use the total cost method, as it can be derived directly from financial accounting and requires less additional cost accounting. Both methods are permitted, however, and ultimately lead to the same annual result.
“The choice between the total cost and cost of sales method mainly concerns the perspective on a company’s cost structure – not the result itself.” – explains Curd Fasching
How does the total cost method (GKV) work?
With the total cost method, expenses are structured according to their type. The income statement therefore shows which types of costs have arisen in the company, irrespective of which business area they can be allocated to.
Typical types of cost are, for example:
- material or goods expense
- personnel expenses
- depreciation
- other operating expenses
One advantage of this method lies in its proximity to financial accounting. Since the types of cost are taken directly from the accounts, the income statement can be prepared relatively easily. At the same time, this presentation clearly shows how a company’s cost structure is developing.
How does the cost of sales method (UKV) work?
With the cost of sales method, costs are structured according to their function within the company. The income statement thus shows in which areas of a company costs are incurred.
Typical functional areas are, for example:
- production or manufacturing
- sales
- administration
This presentation makes it easier in particular to analyse the profitability of individual business areas. For this reason, the cost of sales method is frequently used in larger or internationally active companies.
Which presentation formats are used in practice?
Regardless of whether a company uses the total cost or cost of sales method, the income statement can be presented in different ways.
The step format is frequently used, in which various intermediate results are shown one below the other. This makes it possible to follow the development of the result step by step.
Alternatively, there is the report or account format, which is more closely aligned to the structure of the accounts and is often used for detailed internal evaluations.
The key point is: The presentation format does not change the result, only the way in which the information is structured and presented.
Which key figures can be derived from the income statement?
The income statement can be used to derive key figures that help assess a company’s economic performance. They show how profitable a company is, how its cost structure is developing and how sustainable its earning power is over several periods.
While the income statement presents the result for a period, key figures enable a systematic analysis and comparison over several years. They help to identify developments at an early stage and to better assess operating performance.
Key figures from the income statement are often combined with key figures from the balance sheet. Only this combined view allows a well-founded assessment of a company’s financial situation.
What role do operating performance indicators play?
Operating performance indicators show how successful a company is in its core business. They focus on operating performance and partially exclude individual special effects.
Some of the best-known indicators are, for example:
- Gross profit or gross margin
- EBIT (Earnings Before Interest and Taxes)
- EBITDA (Earnings Before Interest, Taxes, Depreciation and Amortisation)
These indicators help to assess a company’s operating earning power and to compare developments over several periods.
You can find a detailed explanation of these indicators and their differences in Auditrium’s article on EBIT vs. EBITDA.
Which balance sheet ratios complement performance analysis?
For a comprehensive analysis, the income statement alone is not enough. Ratios derived from the balance sheet provide additional information about a company’s financial stability and capital structure.
Typical examples are:
- Equity ratio, which shows the proportion of equity in total capital
- Liquidity ratios, which measure a company’s ability to meet short-term obligations
The combination of performance indicators and balance sheet ratios makes it possible to assess both a company’s profitability and financial stability.
How are the balance sheet and income statement prepared as part of the year-end closing?
The balance sheet and income statement are derived from a company’s ongoing bookkeeping and are finalised as part of the year-end closing. The transactions of a financial year are compiled, reviewed and correctly accrued and valued through various closing activities.
During the year, all transactions are recorded in financial accounting. At the end of the accounting period, the year-end closing is carried out, during which these data are reviewed, supplemented and structured. The goal is to present a company’s economic situation as accurately as possible.
The most important tasks as part of the year-end closing include in particular:
- Reconciliation of accounts to ensure that all postings have been recorded correctly
- Accruals and deferrals so that income and expenses are allocated to the correct accounting period
- Valuations and depreciation in order to present assets realistically
Only after these steps are the final balance sheet and income statement prepared.
“The year-end closing is more than a formal obligation. It ensures that the balance sheet and income statement reflect a company’s economic reality as accurately as possible.” – fiduciary Curd Fasching
What role do accruals and deferrals play?
Accruals and deferrals ensure that income and expenses are allocated to the correct accounting period. Without these adjustments, transactions could appear in the wrong financial year and distort the result.
Typical examples of such accruals and deferrals are transitory items:
- Prepaid expenses and accrued income (transitory assets) when expenses have already been paid but economically relate to the next period. This also includes receivables to which the company is already economically entitled, but which will only be paid in a later period.
- Accrued expenses and deferred income (transitory liabilities) when services have already been rendered but payment is made only later. This also includes obligations for which no invoice has been received by the balance sheet date, but which have already been incurred economically.
These accruals and deferrals ensure that the income statement reflects the actual economic course of a financial year. Especially for accruals/deferrals and the ongoing analysis of the figures, structured reporting such as Analise Franci can help to make such effects transparent and identify developments at an early stage.
Why are valuations and depreciation important?
A company’s assets change in value over time. For example, fixed assets lose value through use or technological progress.
Depreciation takes this loss of value into account in the income statement and spreads the acquisition cost of an asset over its useful life. This makes the annual result more realistic.
Impairments may also be necessary if assets suffer a permanent loss in value. Such adjustments ensure that the balance sheet and income statement portray a company’s financial situation as realistically as possible.
How do companies use the balance sheet and income statement for analysis?
The balance sheet and income statement provide key information on a company’s financial development. Together, they show how profitable a company is, how stable its financing is and how assets and capital structure change over time.
While the income statement mainly makes the earnings situation for a period visible, the balance sheet shows a company’s financial structure and stability. In practice, the balance sheet and income statement therefore serve as the basis for central business management issues, such as the development of revenue, cost structure, financing or equity.
This makes it possible to identify key developments in a company, such as changes in profitability, cost structure, financing or equity.
What role does the income statement play in company analysis?
The income statement shows how revenue, costs and the result develop within an accounting period. This allows important conclusions to be drawn about a company’s economic performance.
The most relevant questions here include:
- How does revenue develop over several years?
- Which cost blocks have the greatest impact on profitability?
- Is there a sustainable profit left after all costs?
The income statement thus helps to assess a company’s operating performance and to identify changes in the business model or cost structure at an early stage.
What indications does the balance sheet provide about stability?
While the income statement shows economic performance, the balance sheet provides important insights into a company’s financing, capital structure and long-term viability.
The balance sheet can be used, among other things, to read the following developments:
- How high is the proportion of equity in total capital?
- How heavily is a company financed by debt?
- Which assets form the basis of business operations?
Analysing these factors helps to better understand a company’s long-term stability and to identify changes in its financial structure.
How do you correctly read and interpret the balance sheet and income statement?
The balance sheet and income statement provide more than just figures; they enable a diagnosis of a company’s financial situation. Anyone who reads both statements systematically can identify developments, risks and economic relationships at an early stage.
What matters is not only the reported result, but also how the underlying income and cost structures develop.
In practice, it is sensible not to analyse the two statements in isolation but to link them systematically. The income statement first shows how profitable a company is within a period. The balance sheet complements this perspective by showing how these results affect assets, liabilities and equity.
A structured analysis therefore usually begins with the income statement and is then complemented by the balance sheet.
“The figures in the annual financial statements only unfold their true value through interpretation. What counts is not just the result, but the development and the underlying drivers.” – says Curd Fasching
What questions should you ask when reading the income statement?
When looking at the income statement, the first step is to understand where a company’s economic success comes from and which factors influence the result.
The following guiding questions are helpful, among others:
- Do revenue and costs develop steadily over the years, or are there strong fluctuations?
- Which cost blocks have the strongest impact on the result?
- Is there a sustainable profit left after deducting all expenses?
These questions help to better assess a company’s operating performance and to identify changes in the business model or cost structure at an early stage.
What indications does the balance sheet provide about stability and risk?
After analysing earnings, the balance sheet provides important information about a company’s financial stability.
Three aspects are particularly central:
- the capital structure, i.e. the ratio of equity to debt
- the asset structure, for example the proportion of fixed and current assets
- Liquidity, i.e. the ability to meet short-term obligations
These factors show how robust a company’s financial foundation is and how well it can react to economic changes.
What warning signs can the balance sheet and income statement reveal?
A combined analysis of the balance sheet and income statement can also point to potential risks at an early stage.
Typical warning signs can include, for example:
- declining margins despite stable revenue
- a sharply increasing proportion of debt capital
- recurring extraordinary or one-off effects in the result
Such developments do not necessarily mean a problem but should be analysed more closely. They may indicate that cost structures are changing, investments are increasing or a company’s business model is evolving.